Interactive Data VisualizationClimate Signals | Hottest Decade
The WorkWhat I did
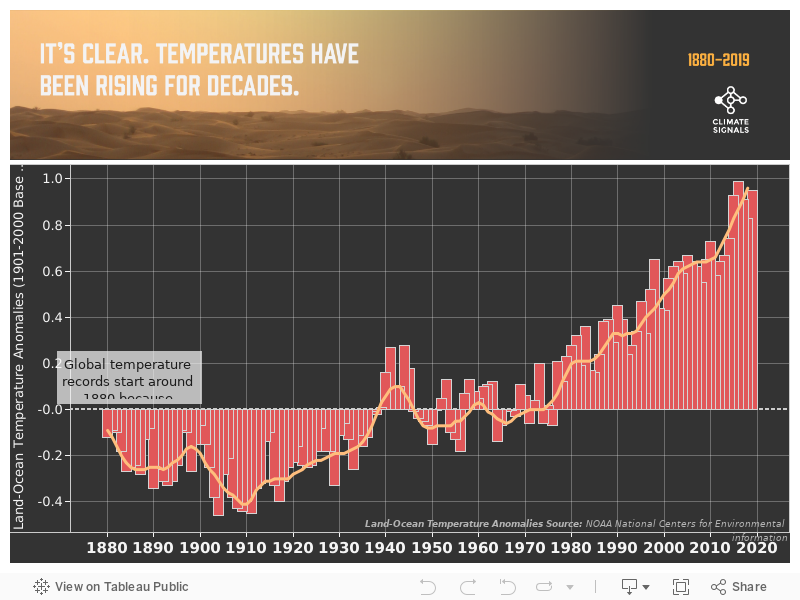
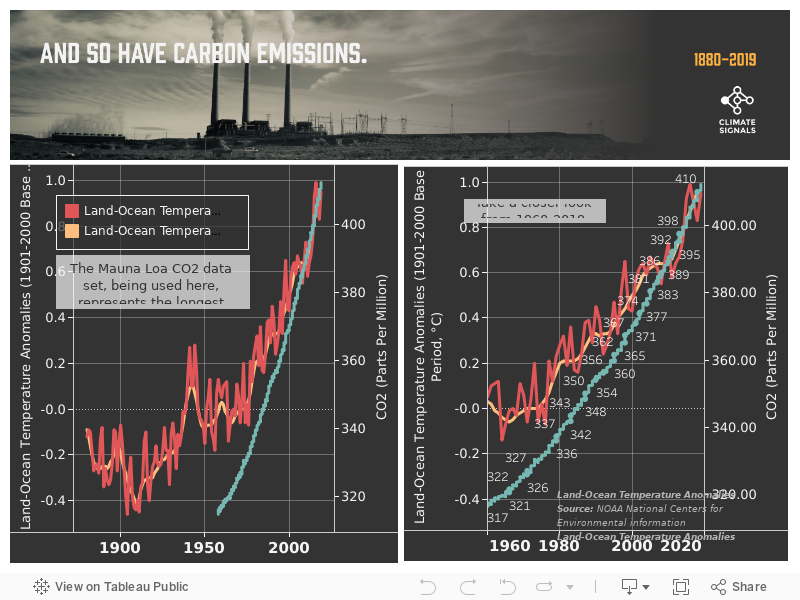
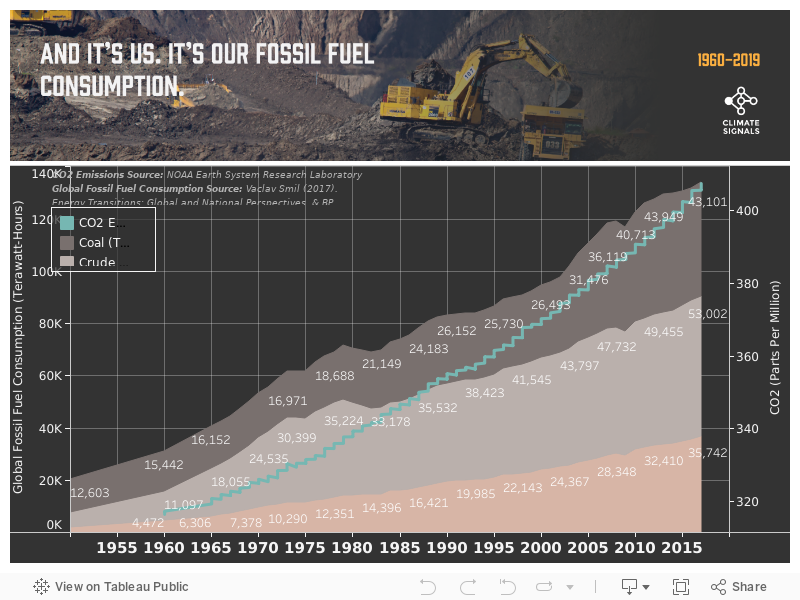
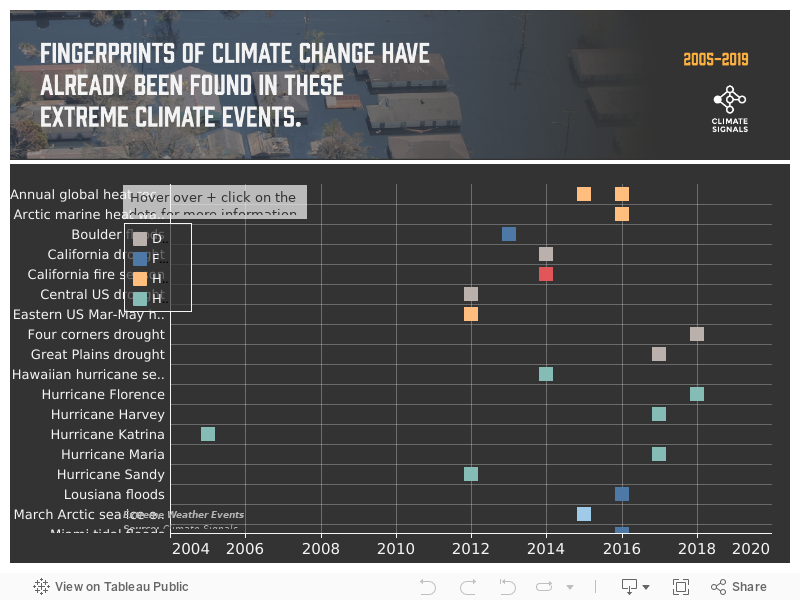
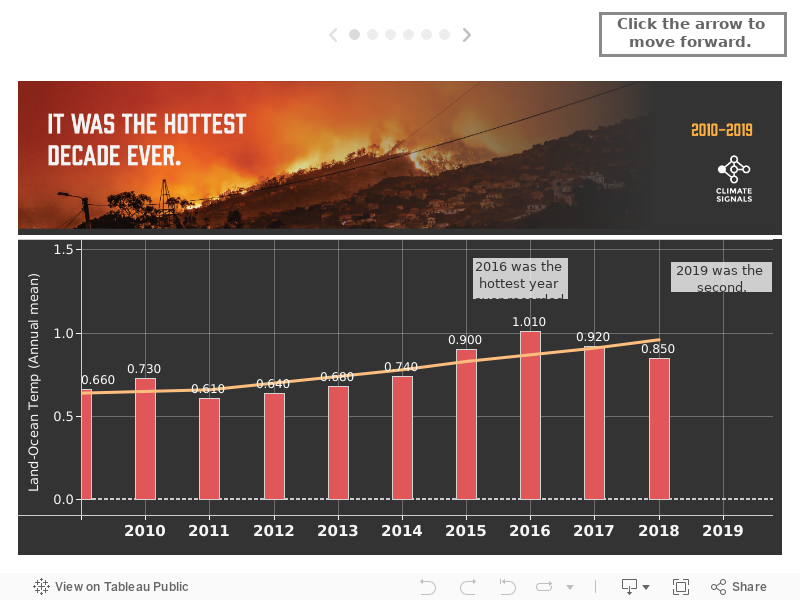
Produced data visualizations for Climate Signals connecting the dots between human-caused climate change and the close of Earth's hottest decade on record — timed to the 2019 news moment marking eight of the ten hottest years ever recorded.